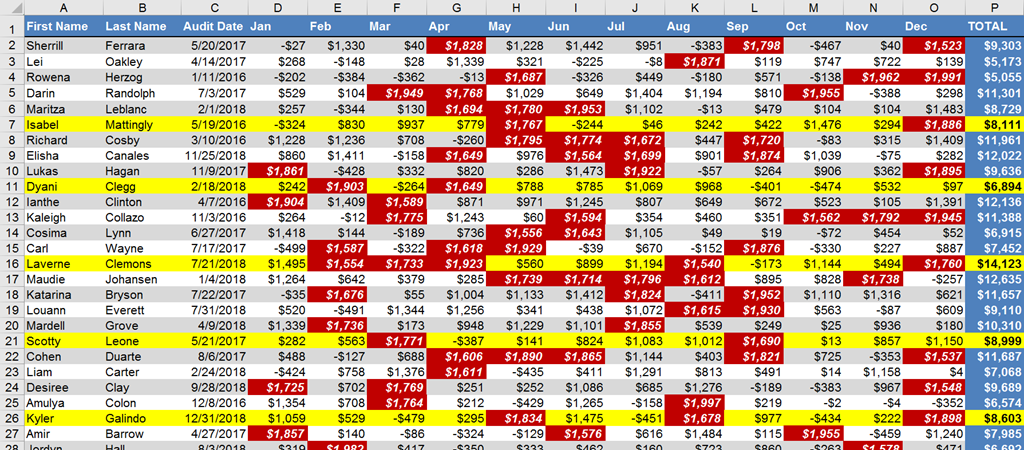
Have you ever wondered why Excel, on occasion, will or will not color a cell according to your instructions? The reason may lie in the order by which Excel applies colors.
Excel applies colors in layers. These layers are comprised of three criteria:
- Colors automatically applied via the implementation of a Data Table
- Colors manually applied by the user
- Colors automatically applied via the implementation of Conditional Formatting
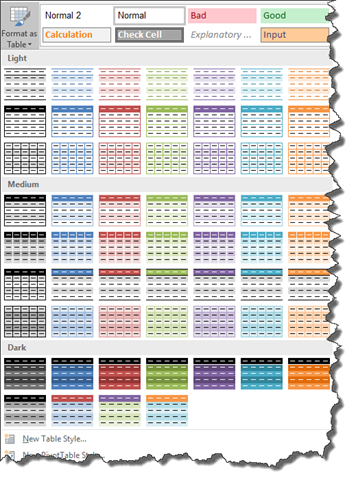
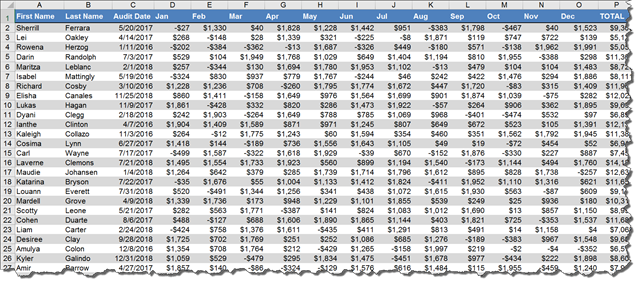
When using Data Tables (located on the HOME ribbon), colors are applied and controlled by the Data Table feature. This is a great way to make tables look beautiful as well as maintaining those colors when user’s manipulate the data; i.e. add/remove rows or sort the data. These colors are assigned first and are easily overwritten by the following two methods.
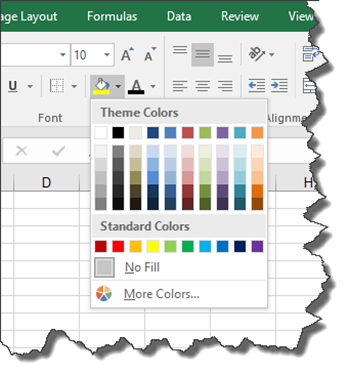
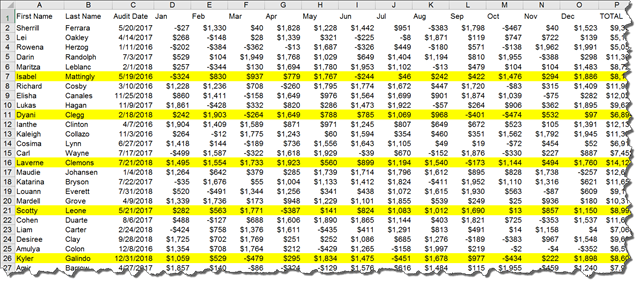
When a user selects a cell (or set of cells) and uses the Cell Fill tool, this will apply the selected color. If the user’s cell selection currently displays color assigned by a Data Table, that color will be replaced by the new user-defined color. User-Defined colors are assigned second and are easily overwritten by the third method.
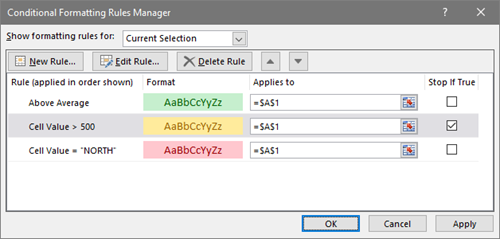
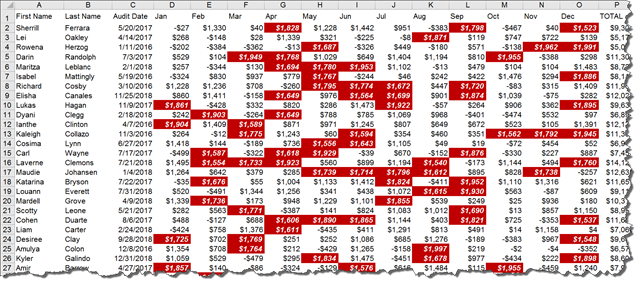
When using Conditional Formatting (located on the HOME ribbon), colors are applied and controlled by the rules set forth in the Conditional Formatting tool. Rules are applied in order that the rules are listed from top to bottom. If more than one rule applies to the same cell, the last qualifying rule is the color to be displayed. A qualifying color can be made to “stay” even if a later rule qualifies by enabling the “Stop If True” checkbox listed to the right of the applicable rule.
A Practical Example
Suppose we have a table of information and we wish to change it cosmetically based on the following criteria:
- Use the Data Table feature to apply a blue color scheme with banded-gray rows
- Manually select certain rows and paint those rows with a yellow fill
- Use the Conditional Formatting feature to change the cell background color to red for every cell with a sale greater than $1,500
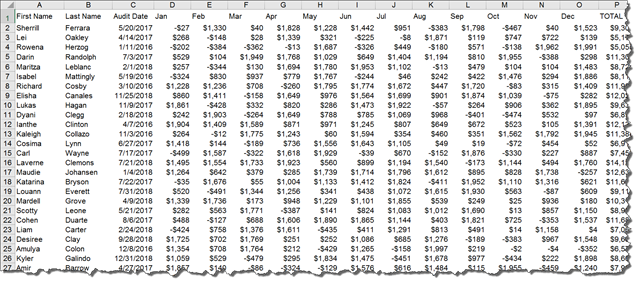
Original Data
Layer 1 – Data Table color assignments
Layer 2 – User-Defined color assignments
Layer 3 – Conditional Formatting color assignments
Stack them atop one another like so…
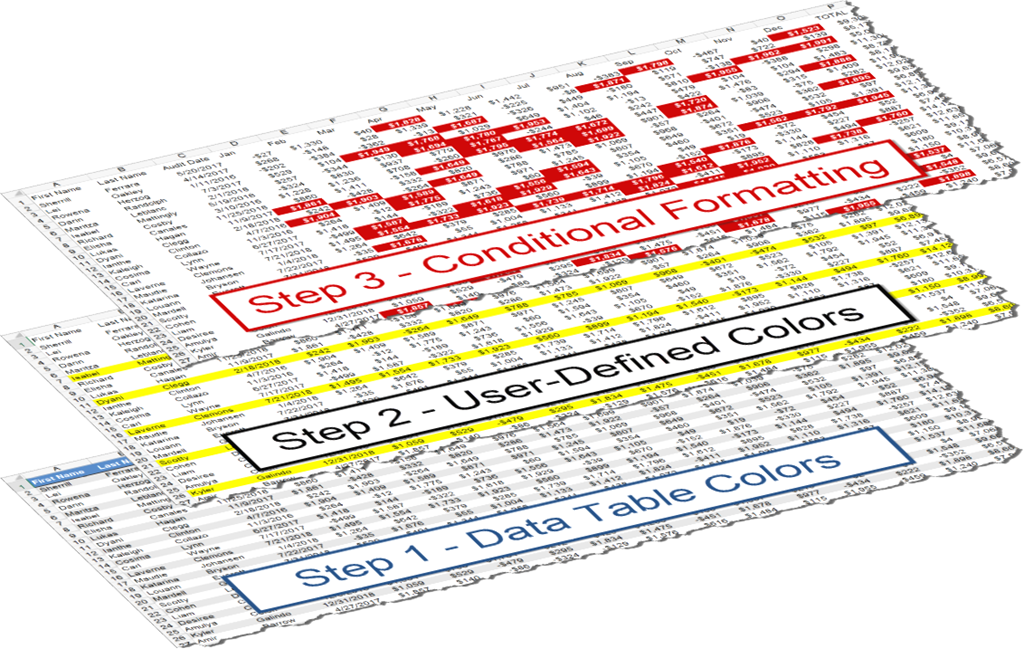
…and the resulting color output is as follows.
